I had a conversation recently with someone who has more of a sysadmin background. We started talking about the intersection of DevOps and networking and while his environment wasn’t large, there was one pain point he talked about – he doesn’t have access to the network switches to ensure they are configured properly for “his” servers and to ensure packets aren’t being dropped, etc. when there are issues with the application, server, or network. And by the way, he really doesn’t want access to the data center switches, because after all, many fear logging into network devices that are in production.
Could DevOps and network automation help here?
In fact, the answer is yes. The goal is to get the right data into the right hands as quick as possible. An automation platform can be used to query the switch to get the exact data the admin needs. For those that have help desks supporting large campus networks, the same philosophy can be used there as well. Help desk, junior admins, and cross-functional team members can now get what they need in just a few seconds.
In order to test this out, I’ve built a test bed using a Cisco Nexus 9000 switch using its NX-API and the Ansible automation framework.
While the remainder of this post walks through how this is accomplished, the main takeaway should be, there may be more opportunities for automation than we think. Keep your eyes open!

Back to it…
Here is a screen shot of the Ansible playbook that I’ll be testing.
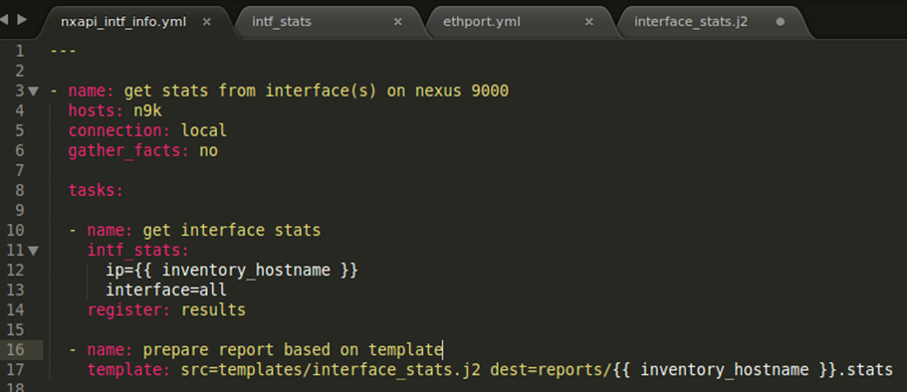
As you can see, this is a pretty small playbook that can be manipulated by anyone. This playbook has two tasks. The first tasks gets the required data from the Nexus 9000 switch. It does this by using the module called intf_stats. The ip of the switch and associated interface we want data on is sent to the module (note the indentation under intf_stats). The data being returned from the device is stored in a new variable called results.
Note: interface supports two options: all or a specific interface, e.g. Ethernet1/1. Sample outputs for each will be shown below.
The second task uses the data returned and formats it using a pre-built template called interface_stats.j2 so that the admin can easily interpret the data.
Now that we’ve taken a quick look at the playbook, let’s run it!
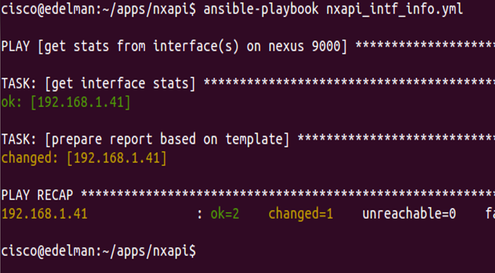
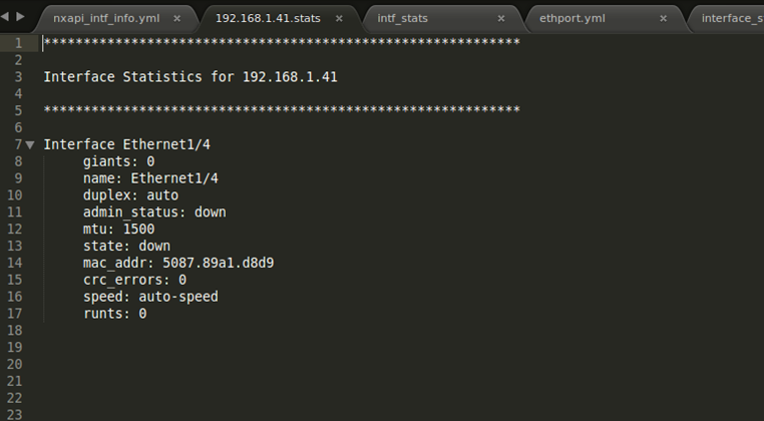
There isn’t anything glamorous about running this Ansible playbook, but we can see everything is okay and the report (template) is created. Let’s take a look at the report.
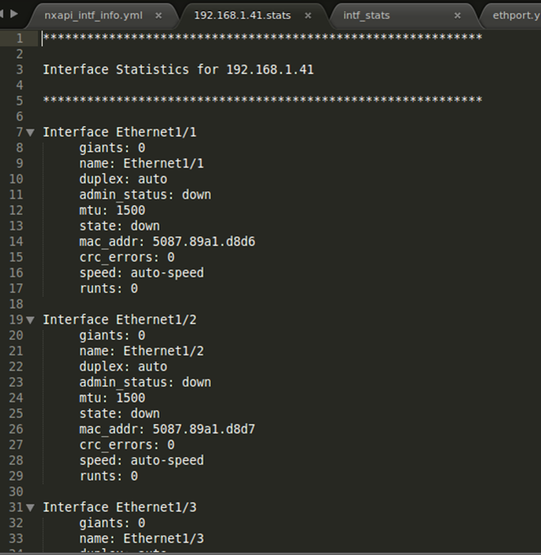
We can see now after running this playbook, the admin has access to all sorts of data without having to engage with a senior network engineer or clicking around through a GUI. Note: this clearly just a sub-set available from a switch. Any data you want can be inserted here too.
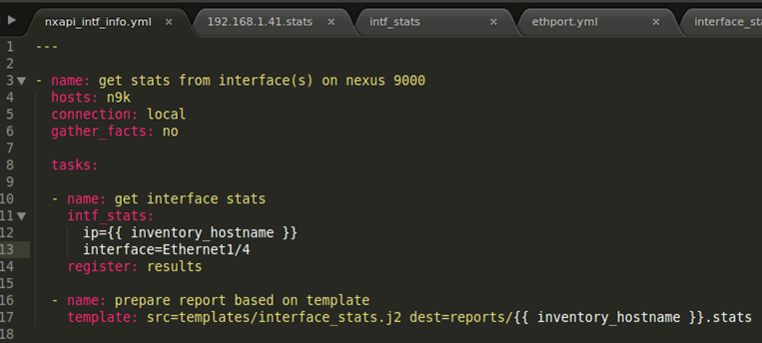
This particular report showed the data for all interfaces although you can only see 3 interfaces in the above screen shot. The next two screen shots show the playbook and report when just one interface is specified.
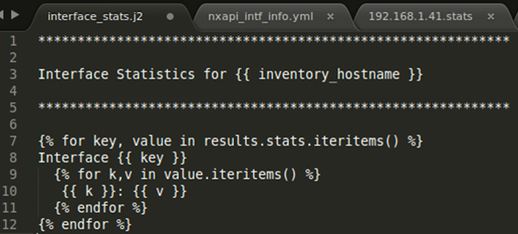
Jinja2 Template
I’m sure some of you will want to see this – the screen shot below shows the j2 template that I used to create the report.
If you are interested in checking out all of the files and code I used, feel free to check them out here.
Let me know if you have any questions or any other thoughts on topics like this!
Thanks, Jason
Twitter: @jedelman8